Information Sheet #: 123
Published in: 2013
The 1989 House of Commons unanimously passed a motion to eliminate child poverty by 2000. 13 years after the target date between 500,000 and 1 million children in Canada continue to grow up in households that are struggling economically (Statistics Canada, CANSIM table 202-0802). In this brief we describe the measures of low-income used in Canada for families and children. Further, we provide the most recent data on low income rates in Canada and across provinces. We then summarize key findings from longitudinal studies about how child poverty affects later life outcomes. The information sheet concludes with a review of the research on poverty and maltreatment.
Measures of low income in Canada
Statistics Canada does not produce an official poverty line. Rather, three measures of low-income have been developed. These measures use annual household income and compare that income against an absolute or relative threshold of basic needs. The thresholds are subject to continuous debate.
The low-income lines are generated for a variety of demographic differences (age, gender, family type) and geography (province and census metropolitan areas). A child is considered to be low income when he or she is in the care of a household who has an annual income below the given measure of low-income for a given economic family type [1], age, gender and geography. For the purposes of this information sheet, we will refer to the low income rates as poverty rates.
LICO
The most commonly cited Canadian Low Income Cut-Off (LICO) is a relative measure of poverty wherein the family is expected to spend 20 percent or more of their income than the average family on basic necessities of food shelter and clothing. LICOs are calculated for before and after tax income (including government transfers) and adjusted for inflation with the Consumer Price Index applied to the base year of 1992 (Murphy, Zhang, & Dionne, 2012). As such, LICOs reflect changes in inflation since 1992, but do not account for changes in the spending patterns of families. LICO lines are calculated for seven family sizes and five community sizes. The after-tax values are typically preferred in analysis because they take into consideration the redistributive social welfare policies such as social assistance and the Canada Child Tax Benefit (Murphy et al., 2012).
LIM
The Low Income Measure (LIM) is a relative measure of poverty. Using the LIM, a household is considered to be low-income when their annual income falls below the threshold of 50% of the median of the distribution for a given household size.
MBM
In Canada, the Market Basket Measure (MBM) is an absolute measure of poverty. The absolute threshold for MBM is set by estimating the cost of purchasing an array of predefined goods and services such as food, clothes and shelter. If a household does not earn sufficient income to make ends meet defined by the market basket they are considered to be low income.
Each of these measures has strengths and weaknesses. For further details on how low incomes are calculated and measured in Canada see the report by Statistics Canada (2011).
Aggregate trends of child poverty over time
Figure 1 shows the rates of child poverty using the LICO before tax and after tax rates over time (1989-2010). We focus mostly on the after tax rates because they take into consideration income transfers and tax credits.
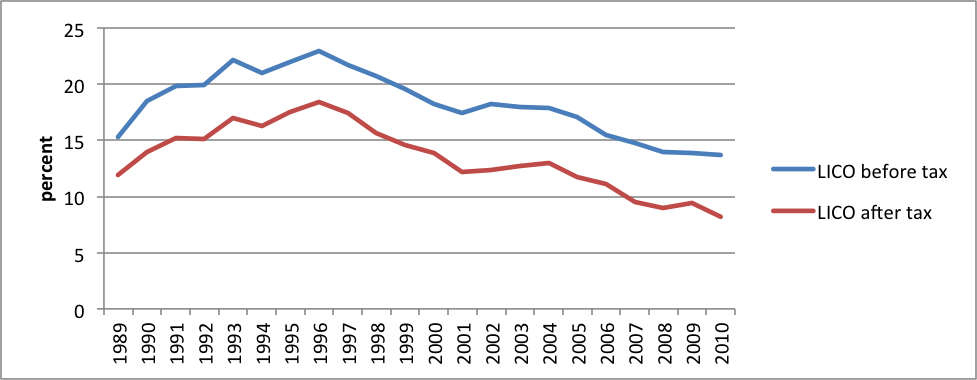
Figure 1: Canada child poverty rates over time*
*Source Statistics Canada. “CANSIM - 202-0802 - Persons in Low Income Families,” 2013.
The data reveal that after tax child poverty rates peaked in 1996 with a rate of 18.4% of all children. Since then the rate has steadily fallen 31% to 8.2% in 2010 (most recent data). When the LIM is used the child poverty rate has increased from 13.7% to 14.5% over the same period (or 6%).
Provincial comparisons
Figure 2 shows the 2010 child poverty rates by province.
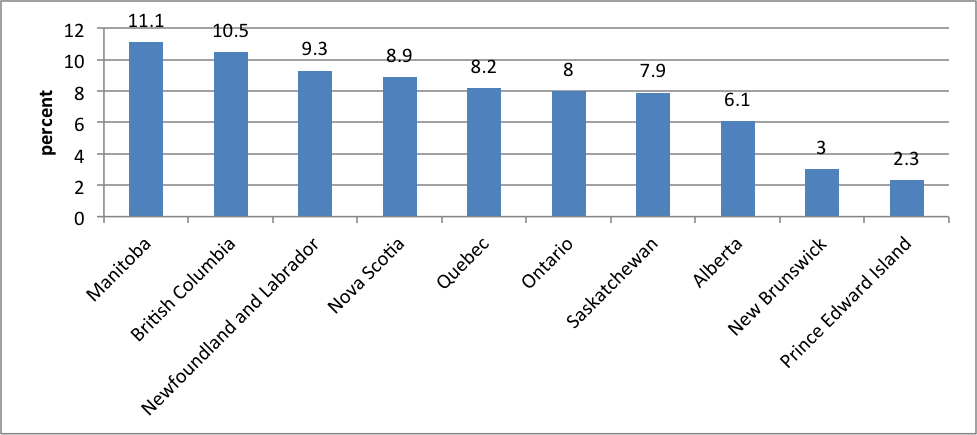
Figure 2: 2010 child poverty AT LICO by province*
*Source Statistics Canada. “CANSIM - 202-0802 - Persons in Low Income Families,” 2013.
We see wide variation across the provinces. The four provinces of Nova Scotia, Newfoundland and Labrador, British Columbia and Manitoba have child poverty rates higher than the 8.2% national average. New Brunswick and Prince Edward Island have rates at 3% or lower. Of the Canadian provinces, 7 have action plans to combat poverty. Within these action plans, Ontario is the only province that targets child poverty. Ontario’s poverty action plan involves $2.5 billion to explicitly reduce the number of children living in poverty by 25% over five years (2008-2013) [2].
International comparisons
The LIM is used for international comparisons. 13.3% of children live in households with equivalent incomes lower than 50% of the national median after taxes and transfers, ranking Canada 24th of 35 industrialized nations (UNICEF Innocenti Research Centre, 2012).
What are the consequences of growing up in a low income household?
It is commonly understood that growing up poor is a risk factor for later life outcomes. Researchers have recently documented these effects by showing major differences between poor, near-poor, and non-poor children at kindergarten. For example, 72% of non-poor children are proficient in recognizing words compared to only 19% of poor children (Duncan & Magnuson, 2011). These differences at kindergarten compound across the life cycle. The same authors reported that the percentage of men who had been arrested was much higher among those who were poor as children compared to those who were not poor (26 % v. 13%) [3].
The best knowledge tends to emerge from systematic reviews across places and times. Duncan & Brooks-Gunn (1997) analyzed 10 longitudinal datasets to conclude the following impacts of poverty on developmental outcomes:
- Selective impact. Family income has a larger association with measures of child cognitive ability and achievement. There was less impact on measures of behavior, mental health, and physical health.
- Time matters. Poverty in early childhood has a stronger impact on development outcomes than poverty experienced in adolescence.
- Non-linear influence. The association between income and achievement is non-linear. In other words, the severity of poverty matters. Effects were strongest at the lowest levels of incomes.
Using longitudinal data from the Panel Study of Income Dynamics that tracked children born between 1968 and 1975 and followed them until ages 30-37, Duncan et al. (2010) examined economic impacts of growing up in poverty. The authors showed that a $3,000 increase in annual parent income between a child’s prenatal year and fifth birthday is associated with 19% higher earnings and a 135-hr increase in work hours in adult life.
Child poverty and child maltreatment
Research in the US has shown that children from low SES families are at a five times greater risk for child abuse and neglect compared to their upper SES counterparts (Sedlak et al., 2010). The exact risk in a Canadian context is unknown. However, a recent review of the child maltreatment literature in Canada over the past 25 years revealed 16 studies that explicitly examined some element of child poverty or economic disadvantage (Rothwell & De Boer, in preparation). Almost all studies found a bi-variate relationship between child poverty and maltreatment. However, in at least two studies economic hardship was not related to chronic abuse patterns (Ethier, Couture, & Lacharité, 2004) or maternal negative emotions toward children (Martini, Root, & Jenkins, 2004). Disentangling the causal mechanism(s) between child poverty and neglect is difficult due to numerous methodological challenges.
Recent methodological advances in the conceptualization, measurement, and analysis of neighborhood disadvantage data are promising for child welfare research. For example, in Quebec, Esposito (2012) examined when and for who initial out-of-home placement was most likely to occur for a sample of over 120,000 children investigated for maltreatment for the first time between 2002 and 2010. A neighbourhood socioeconomic disadvantage index was created using the 2006 Canadian Census data and merged to the provincial clinical-administrative child protection data [4]. Controlling for child and family functioning concerns, a unit increase in neighborhood area socioeconomic disadvantages at initial investigation increased the risk of out-of-home placement by 55% for children aged 0 to 9.
Overall, being born into and growing up in a poor household negatively affects children in the short term and across the life-cycle. These effects have major implications for society. Considering these consequences of growing up poor, much work remains for child welfare research. There is a great need to develop better and more consistent knowledge about how child poverty affects entry into the child welfare system and the extent to which anti-poverty interventions affect the risk of child maltreatment.
References:
Duncan, G. J., & Brooks-Gunn, J. (1997). Consequences of growing up poor. New York: Russell Sage Foundation.
Duncan, G. J., & Magnuson, K. (2011). The Long Reach of Early Childhood Poverty. Pathways Magazine, 22–27.
Duncan, G. J., Ziol-Guest, K. M., & Kalil, A. (2010). Early-Childhood Poverty and Adult Attainment, Behavior, and Health. Child Development, 81(1), 306–325.
Esposito, T. (2012). From initial maltreatment investigation: Exploring the placement trajectories of children in the Québec child protection system. McGill University, Montreal.
Ethier, L. S., Couture, G., & Lacharité, C. (2004). Risk factors associated with the chronicity of high potential for child abuse and neglect. Journal of Family Violence, 19(1), 13–24.
Gamache, P., Pampalon, R., & Hamel, D. (2010). Methodological guide-The material and social deprivation index: A summary. Institut national desanté publique Québec.
Martini, T. S., Root, C. A., & Jenkins, J. M. (2004). Low and middle income mothers’ regulation of negative emotion: Effects of children’s temperament and situational emotional responses. Social Development, 13(4), 515–530.
Murphy, B., Zhang, X., & Dionne, C. (2012). Low income in Canada: A multi-line and multi-index perspective. Statistics Canada 75F0002M, 002(001). Retrieved from http://www.statcan.gc.ca/pub/75f0002m/75f0002m2012001-eng.pdf
Rothwell, D. W., & De Boer, K. (in preparation). Operationalizing economic hardship in child maltreatment research in Canada: A literature review.
Sedlak, A., Mettenburg, J., Basena, M., Petta, I., McPherson, K., Green, A., & Li, S. (2010). Fourth national incidence study of child abuse and neglect (NIS-4): Report to Congress. Washington D.C.: US Department of Health and Human Services, Administration for Children and Families.
Statistics Canada. (2011). Low Income Lines, 2009-2010 (No. 75F0002M). Ottawa, ON: Statistics Canada. Retrieved from http://www.statcan.gc.ca/pub/75f0002m/75f0002m2011002-eng.htm
Statistics Canada. (2013). CANSIM - 202-0802 - Persons in low income families.
UNICEF Innocenti Research Centre. (2012). Measuring child poverty: New league tables of child poverty in the world’s rich countries (No. 10) (p. 40). Florence: UNICEF Innocenti Research Centre.
[1] Statistics Canada defines two household types: the economic family is any two or more persons related by blood, marriage, common-law or adoption and who share the same dwelling. There is no restriction on same or opposite sex, age or degree of blood relation. Unattached individuals are recognized by Statistics Canada as individuals who either live alone, or if not, those they share household with hold no blood, marriage, adoption or common-law relationship.
[2] Ministry of Children and Youth Services.“Breaking the Cycle: Ontario’s Poverty Reduction Strategy.” Government of Ontario, 2008.
[3] These are complex relationships that involve many other factors. Other factors (e.g., neighborhood characteristics, school quality, biological factors) may be correlated with outcomes that may also be correlated with poverty (commonly referred to as endogeneity).
[4] Neighbourhood areas were identified using Canadian 2006 Census dissemination areas (the smallest geographic unit in the census with a population ranging from 400 to 700 persons). Following Gamache, Pampalon & Hamel (2010), six neighborhood area socioeconomic indicators were identified for each dissemination area: (1) total population 15 years and over who are unemployed or not in the labour force; (2) median income in 2005 for population 15 years and over; (3) total persons in a private household living alone; (4) total population 15 years and over who were separated, divorced or widowed; (5) family median income in 2005 and; (6) median household income in 2005. The three income indicators were transformed by subtracting the score by its maximum value so each one-unit increase represents an increase in economic disadvantages. Indicators 2, 3, 4, 5, and 6 were normalized using Log10. A principal components analysis reduced the data to a single index representing socioeconomic disadvantages for each dissemination area. Construct scores were calculated for each dissemination area (10,907 dissemination areas in Québec) with the lowest score representing low risk socioeconomic disadvantages and high score representing high risk socioeconomic disadvantages. This composite index was then merged to the child protection clinical-administrative data representing 42,989 unique geographic areas with 10,778 neighbourhood area socioeconomic disadvantage estimates.